$GRANDNATIONALThe economics of a $943 million tour
Kendrick Lamar and SZA grossed $390.7M across 47 shows. Fans spent an estimated $552M more in the cities around the stadiums. Here is where the money went, and how the cultural property scores under CPRS™.
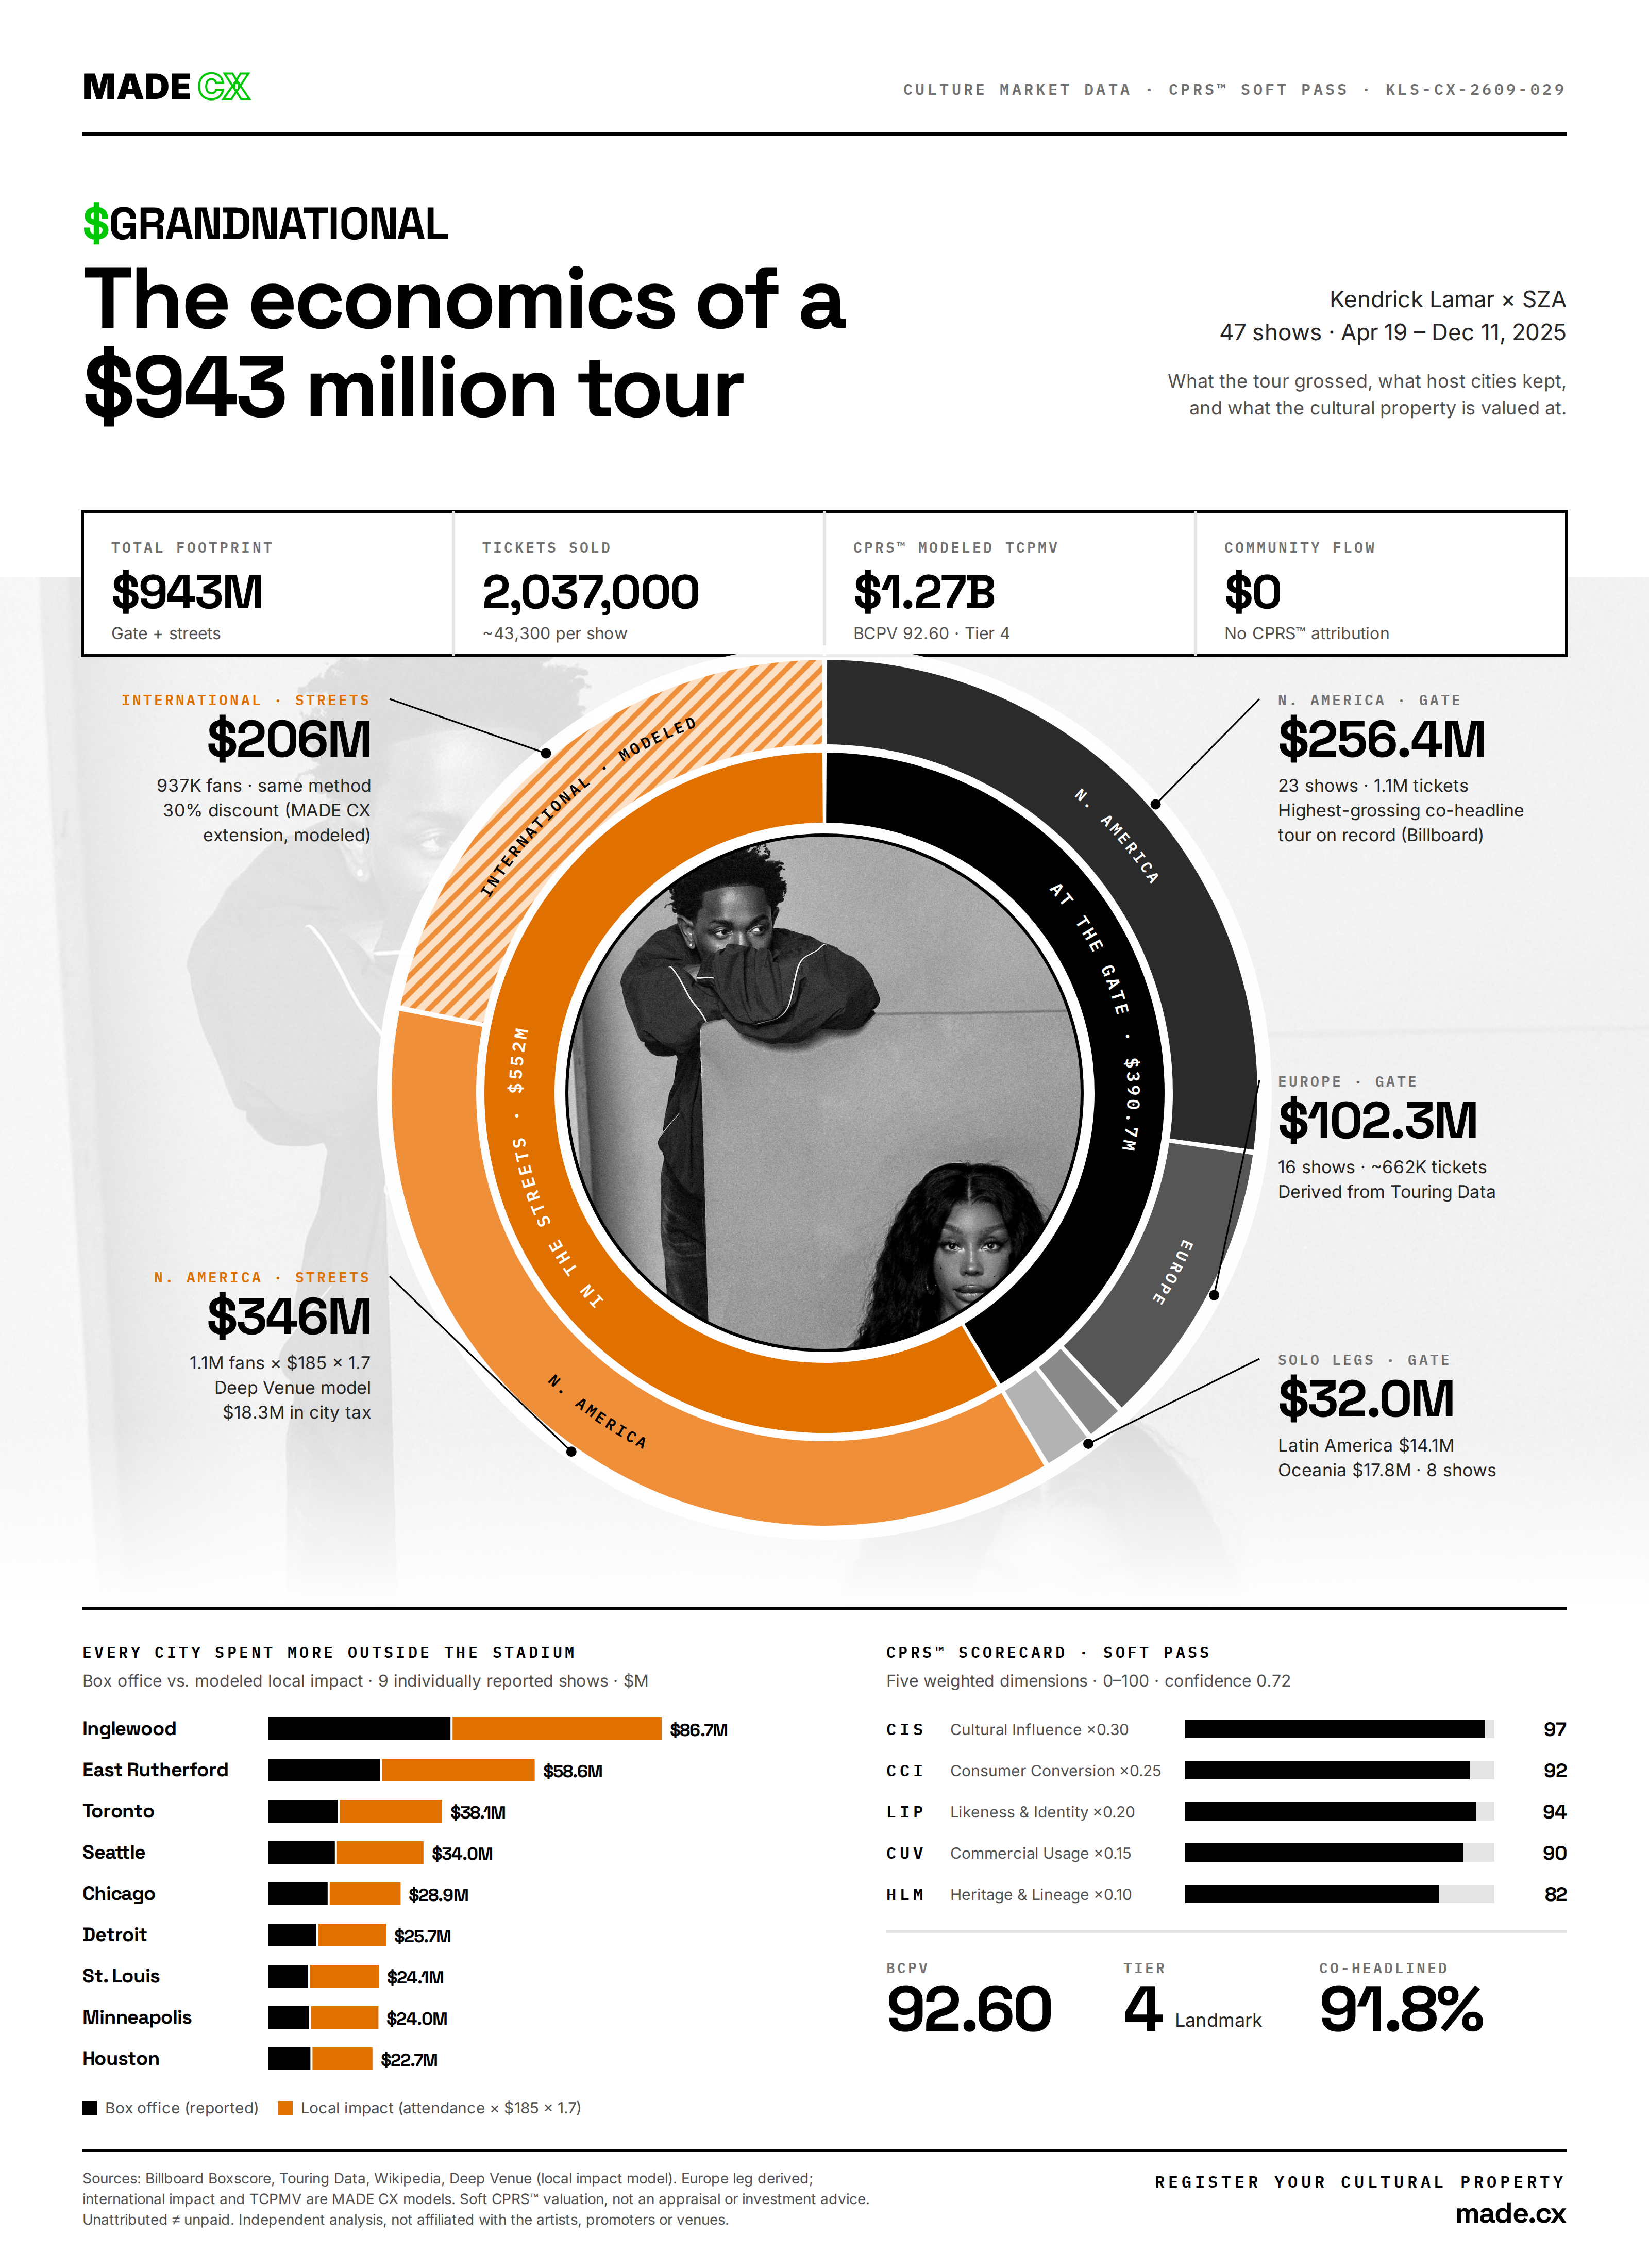
Inner ring: gate vs. streets, share of the $943M footprint. Outer ring: each leg's box office and each region's modeled visitor spending. Hatched = MADE CX model. Hover or tap a segment for detail. High-resolution PNG: 3200 × 4400.
Your culture moves money too. Put it on the ledger.
This is what a CPRS™ valuation looks like at stadium scale. MADE CX runs the same five-dimension standard for artists, estates, archives and brands of every size.
- A scored BCPV and a modeled value band for your property
- Registration on a public cultural-property ledger
- An 80/16/4 split that routes value back to originators and community
Gross, attendance and show counts: Billboard Boxscore via Wikipedia, Kiss 95.1 (Sep 28, 2026) and Touring Data. The European leg ($102.3M, ~662K tickets) is derived from Touring Data's $358.71M co-headlined total less the North American leg. City-level figures and the local-impact method (attendance × $185 × 1.7; city tax ~9% of visitor spend) are from Deep Venue. The international extension ($206M) applies the same method with a 30% discount because $185 is a U.S. benchmark.
CPRS™ figures are a soft pass: BCPV 92.60 (CIS 97 · CCI 92 · LIP 94 · CUV 90 · HLM 82), confidence 0.72, modeled TCPMV $1.27B. Not an appraisal, price or investment advice, and not an estimate of either artist's earnings. Unattributed ≠ unpaid. Independent analysis, not affiliated with or endorsed by the artists, promoters or venues.